How to Read TikTok Analytics and Actually Change Something

Maxime Dupré
7/30/2026
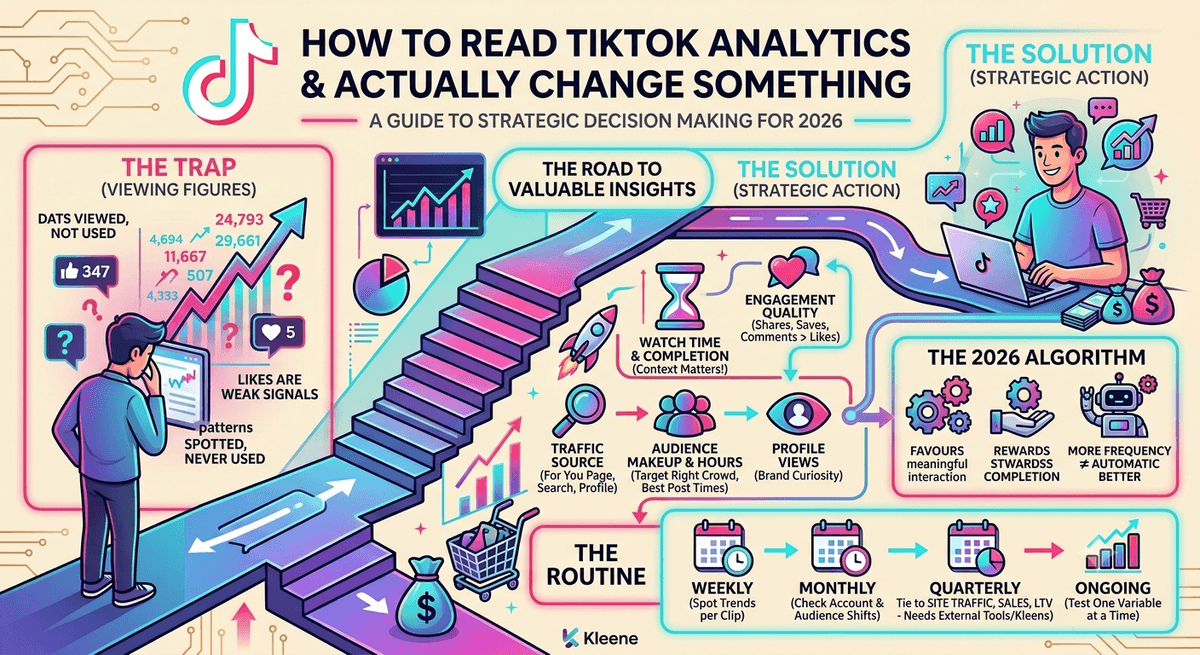
Opening the dashboard takes seconds. Getting value out of it takes more. Almost any marketing team can pull up TikTok Studio and stare at figures. Fewer can say what they will do differently on Monday. Fewer still can say whether the channel earns anything for the business. This piece closes that gap: the figures that shift strategy, what the 2026 ranking system rewards, and a routine that turns checking into deciding.
Want a software comparison instead, TikTok Studio against Metricool, Pentos and the rest? That is a separate question, covered in our TikTok analytics tools guide. This one assumes you already have the software and want to use the data.
Why the figures usually change nothing
The habit looks like work. Someone opens the dashboard, notes whether the newest clip went up or down, and leaves. Data gets viewed but never questioned. Patterns get spotted but never used. The question that counts, what TikTok did for the business, stays open, since the platform’s own reports do not reach that far.
That creates a specific complaint. A clip earns 200,000 views. You cannot tell if any of those people landed on your site, bought anything, or looked anything like your buyer. Brands lose faith right there and decide TikTok “doesn’t work for us”, when the real problem is they never saw enough to judge.
Where the platform keeps your data
Creator accounts find reporting inside TikTok Studio, reached through the profile. Business accounts use Business Suite. Four tabs organise it.
| Tab | What it holds |
|---|---|
| Overview | Account results across your date range: reach, profile views, plus product clicks, payments and GMV for TikTok Shop sellers |
| Content | Clip-by-clip breakdown, where most of your time goes and most useful signals live |
| Followers | Audience makeup and the hours they are online |
| LIVE | Streams tracked apart, with concurrent viewers and live shopping |
Good enough for content calls. Not enough for business calls. That split runs through everything below.
How to read TikTok analytics: five figures worth your time
Dozens of numbers exist. Five deserve attention.
| Figure | What it answers |
|---|---|
| Watch time and completion rate | Whether the clip holds attention, which is what the ranking system asks too |
| Engagement quality | Comments, shares and saves, tracked apart from likes |
| Traffic source | For You page, search, profile or followers |
| Audience makeup and online hours | Who watches, and when to post |
| Profile views | Curiosity about the brand behind the clip |
Watch time is total duration spent. Completion rate is the share who reach the end. One trap: completion needs context. Ninety percent on a ten-second clip and sixty percent on a ninety-second clip are not equal wins. Follow the trend across your own library instead of hunting an absolute benchmark.
Likes are the weakest signal here. A share means somebody passed it on. A save means somebody wanted it later. Neither happens by accident, so both beat a like that costs nothing. Read them against engagement rates for accounts your size, not against a global average.
Traffic source tells you if you are reaching fresh viewers or the same crowd again, and whether TikTok’s growing search behaviour is finding you. Almost no search views is a genuine hole in strategy.
Demographics tell you whether viewers resemble wanted customers. A big count from the wrong crowd is worth less than a small count from the right one. Online hours should set your posting schedule and rarely do. Profile views measure who liked a clip enough to check the author, and raw counts miss that entirely.
What the 2026 ranking system rewards
The 2026 algorithm openly favours meaningful interaction over passive views. That is not slogan language.
Clips that pull views but little interaction now get pushed less than clips with smaller counts and stronger completion and engagement. You can hold 100,000 followers and no sway if none of them react. So chasing views chases the wrong target. A clip at 50,000 views with strong completion and heavy sharing beats one at 200,000 views with thin interaction, judged by the same signals that decide how far your next upload travels.
Posting frequency shifts too. Smaller accounts average roughly six uploads a month, the largest brands roughly fifteen. More is not automatically better. Extra uploads that thin the quality signals work against you.Where TikTok’s reporting stops
Here is the honest ceiling. The platform explains how content did on the platform, and almost nothing about what followed. Did the viewer visit? Buy? Were they new, or already yours, and did they match your best segment? TikTok Studio cannot say, because that record sits in your business.
The cheapest patch is UTM tags on bio links, which credit site traffic and sales back to TikTok inside web analytics. A full answer needs more: TikTok results pulled into one place beside CRM, paid media, email and commerce records, so questions can cross the whole funnel. Which formats bring your best site visitors? Which segments buy at higher rates? How does TikTok compare against the rest of your spend?
None of that lives inside TikTok Studio, and we will be plain that building it is our job. Kleene loads your TikTok records into the same warehouse as everything else, so the channel stops being a walled-off scorecard. With unified data, the methods that answer budget questions open up: media mix modelling and digital attribution that weigh channels against each other and model which touchpoints really caused a sale, rather than crediting the last click. KAI Assistant lets you ask, in plain English, what TikTok added to acquisition last quarter, answered from your own numbers.
A routine for how to read TikTok analytics
Value comes from a rhythm you keep, not from software. Four layers work.
| Frequency | Job |
|---|---|
| Weekly | Per clip from the past seven days, log completion, interaction quality and traffic source. Flag outliers against your recent average, then ask why. Weekly catches real trends, skips daily noise and spots trouble early without post-by-post fretting. |
| Monthly | Account trends: reached audience, profile views, shifts in follower makeup. Check whether your mix hits the target crowd, and which pillars carry weight. |
| Quarterly | Tie TikTok to outcomes: site traffic from TikTok, conversion from that traffic, customers traced back where possible. Run beside paid and other organic channels. Most teams skip this one, because native tools cannot support it without heavy manual exporting. |
| Ongoing | Test one variable at a time. Alter format, caption length and posting hour together and you learn nothing. Alter one, record the result, repeat. |
Habits of teams who get this right
They settle what TikTok is for before reading a single figure. Awareness, product discovery and selling through TikTok Shop are separate jobs, and the job decides which figures are signal.
They treat platform data as one input, not a self-contained scorecard. That is the only way to notice an average clip sending high-quality traffic while a viral one sends none.
They review on a fixed slot. Scheduled reviews expose trends. Spot-checking after every upload just breeds nerves.
TikTok never stands alone
Whether TikTok deserves the money is a media mix question. Answering it means comparing its share of acquisition and revenue against other channels on equal terms. Hard, when TikTok records sit in TikTok Studio, paid social in Meta Business Suite, CRM in HubSpot and commerce in Shopify, each speaking its own dialect.
Kleene’s platform for marketing exists to gather all of it, joining TikTok with 200+ other sources in one warehouse under an AI analytics layer that runs attribution, media mix modelling and segmentation across the lot. The question stops being “how did TikTok do this month” and becomes “what did TikTok add to new customer acquisition against spend, and how does that stack up beside paid search”. That question moves budget, and only unified data answers it.
Bring us your setup and we will show you TikTok read in company rather than in isolation. Still choosing day-to-day software? The tools guide is the companion to this piece.
Before any budget call, check that your findings hold up. Our free statistical significance calculator validates marketing insights first.